experimentum.kz

Virtual chemistry

 Isotope stability and radioactive decay

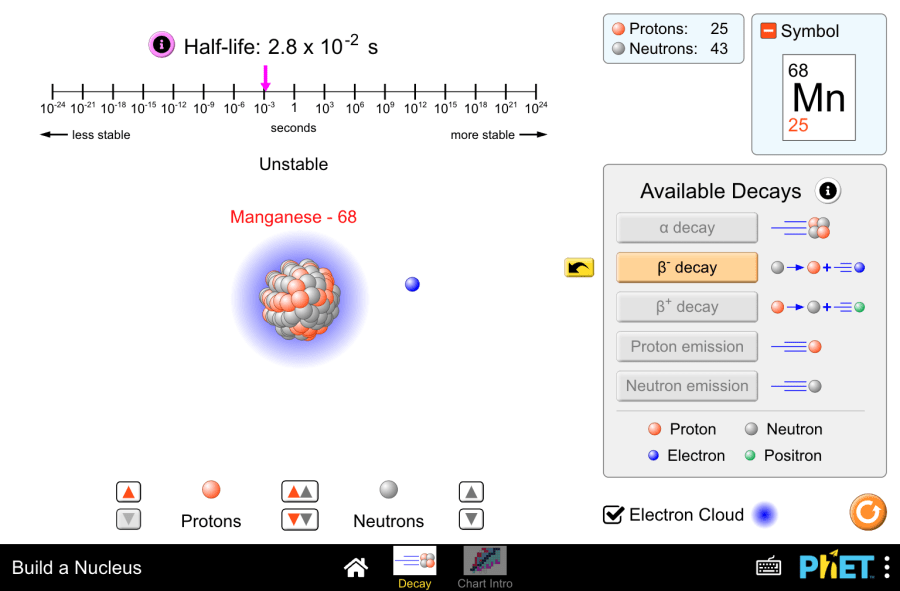
The title of the Project: Isotope stability and radioactive decay This virtual laboratory is intended for use in chemistry classes on the following topics: Purpose of the virtual laboratory work: Characteristics of atomic particles Table 1 Particles Mass number Charge number Note proton 1  +1 The number of protons is equal to the ordinal number of the element neutron 1  0 The number of neutrons can be found by the following formula:N=А r  -Z , А r  -atomic mass number, Z – number of protons electron 0  -1 The number of electrons is equal to the ordinal number of the element Practical part 1.Launch the simulation. You will have two screens to choose: “Decay” and “Chart intro”. Let’s start with the “Decay” screen. 2.In this screen you can build a nuclide from protons and neutrons. It allows building of nuclides up to 94 protons and 146 neutrons.You can place neutrons and protons by dragging them into the play area or by using the spinners. The spinner between the protons and neutrons places both a proton and neutron into the nucleus simultaneously.  3.As the number of nucleons in the nucleus changes, the sim updates the element symbol (eg. Helium-5) number of protons and neutrons, and stability of the nuclide (stable or unstable)  4.“Info” button by half-life opens a static timeline with a dynamic nuclide half-life display. 5.Five decay types are represented within the simulation: α decay, β+ decay, β- decay, proton emission, and neutron emission.  6.Unstable nuclides decay into stable nuclides through one of these decay paths. Virtual experiment  7.Build an unstable isotope. For example, Beryllium-8. See the available decay.  8.Analyze the decay icon symbols to predict the final element after decay. Then press the button to see the animated decay process. 9.Observe how the various readouts (symbol, half-life, nucleon counter) update. Determine the resulting element. Write the balanced nuclear decay equation for the observed process. 10.Try another isotopes with different decays. 11.You can press the yellow button to watch the animation again. Determine the resulting element. Write the equation.  Conclusion This virtual experiment effectively demonstrated radioactive decay using PhET’s “Build a Nucleus” simulation. By manipulating unstable isotopes, students visualized the decay process and explored the concept of half-life. This interactive exploration provides a valuable foundation for understanding the fascinating world of nuclear reactions.

 Isotope stability and radioactive decay Read More »

Mechanism of Ionic Bonding

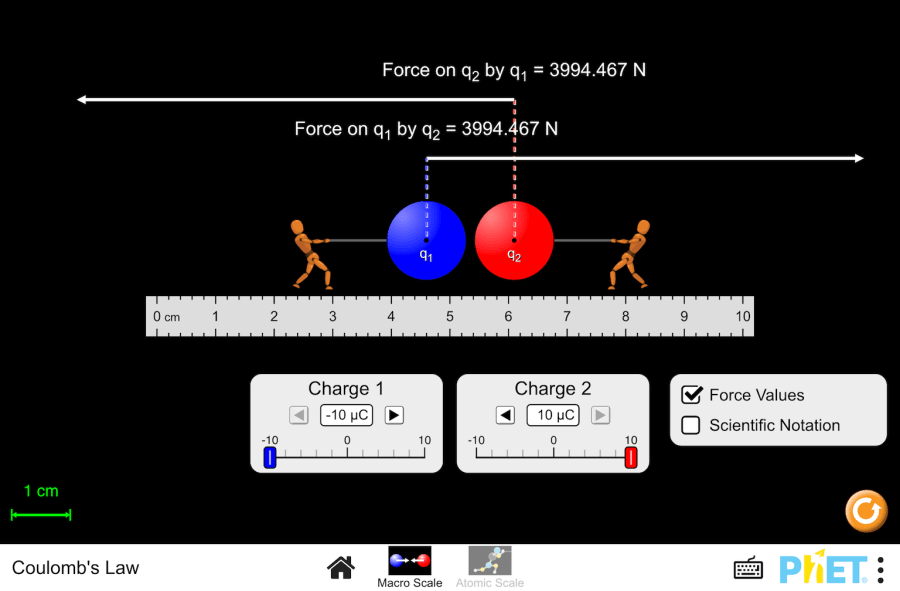
The title of the Project: Mechanism of Ionic Bonding This virtual laboratory is intended for use in chemistry classes on the following topics: Objectives: Theory Ionic bonding is a type of chemical bond formed by the electrostatic attraction between oppositely charged ions. Ions are atoms or groups of atoms that have gained or lost electrons, resulting in a positive (cation) or negative (anion) charge. Coulomb’s Law and Ionic Bonding: Coulomb’s Law describes the force of attraction or repulsion between two charged particles. It states that the force is directly proportional to the product of their charges and inversely proportional to the square of the distance between them. This law plays a crucial role in ionic bonding: Key Points: Formation of Ionic Bonds: Ionic bonds are formed when an atom loses one or more electrons, becoming a cation, and another atom gains one or more electrons, becoming an anion. The oppositely charged ions attract each other due to electrostatic forces. Example: Sodium Chloride (NaCl) In the formation of sodium chloride (NaCl), a sodium atom (Na) loses an electron, forming a sodium cation (Na⁺). A chlorine atom (Cl) gains an electron, forming a chloride anion (Cl⁻). The resulting sodium cation and chloride anion are attracted to each other by electrostatic forces, forming the ionic compound sodium chloride. Properties of Ionic Compounds: Practical part This activity uses the PhET “Coulomb’s Law” simulation to investigate the relationship between charge, distance, and the force of attraction or repulsion between charged particles. 2. Explore the interface by adjusting the charges, their positions, and observing the resulting forces. Reset the simulation when finished. Virtual experiment No.1: Charge Signs and Force  3. Set Charge 1 to -8 µC and Charge 2 to +8 µC. Observe the force between the charges. What happens? What does the direction of the arrow indicate? 4. Change Charge 1 to +8 µC. What happens now? What does the arrow direction tell you? Conclusion: Opposite charges attract, while like charges repel. Virtual experiment No.2: Magnitude of Charge and Force : 5. Set Charge 1 to 0 µC. What happens to the force? 6. Gradually increase the magnitude of Charge 1 (negative) by 1 µC each time. Observe the force with each change. 7. Repeat step 6, but increase Charge 1 (positive) until +10 µC. Observe the force. Conclusion: The greater the magnitude of the charge, the stronger the electrostatic force (both attractive and repulsive). Virtual experiment No.3: Distance and Force: 8. Set Charge 1 to -8 µC and Charge 2 to +8 µC. 9. Gradually move Charge 1 closer to Charge 2 (1 cm at a time). Observe the force with each movement. 10. Now, gradually move Charge 1 farther from Charge 2 (1 cm at a time). Observe the force with each movement. Conclusion: The force becomes stronger as the distance between the charges decreases. Conversely, the force weakens with increasing distance. Conclusion This exploration with the PhET simulation demonstrates the relationship between charge, distance, and the resulting electrostatic force. Opposing charges attract, while like charges repel. The force’s strength is directly proportional to the magnitude of the charges and inversely proportional to the distance between them.

Mechanism of Ionic Bonding Read More »

Beer’s Law

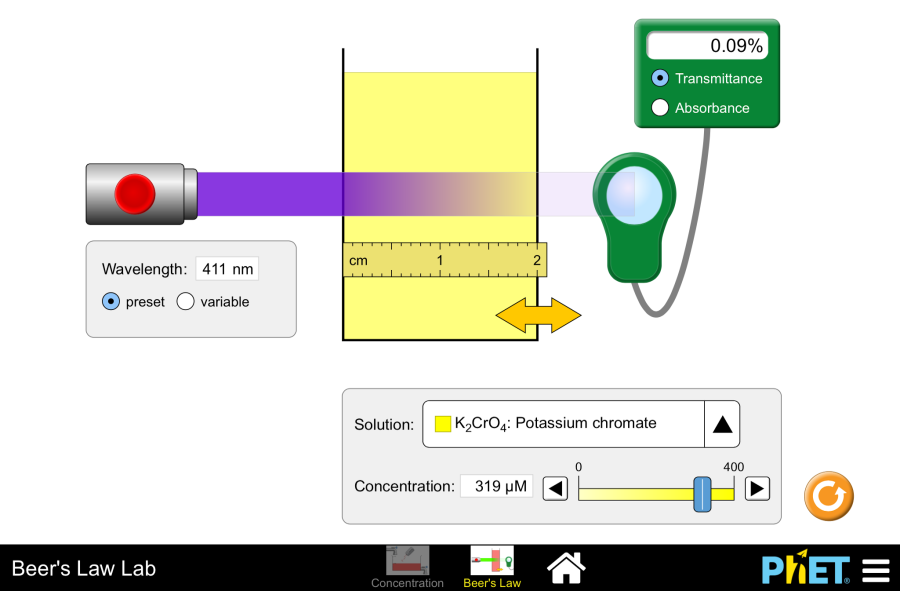
The title of the Project: Beer’s Law Objectives: Theory Beer-Lambert Law is a fundamental principle that describes the interaction of light with solutions. It states that: Colored solutions appear colored because they absorb light of certain wavelengths and transmit others. For example: A spectrophotometer is an instrument used to measure the absorbance of light by solutions. It allows for the determination of the concentration of a solution as well as the identification of its components. Practical part This guide will take you through the PhET Interactive Simulations’ Beer’s Law Lab, where you’ll discover how solutions work and the science behind colored solutions! The Beer’s Law Screen The Beer’s Law screen allows you to discover how the concentration of a colored solution can be determined experimentally. 2.Use the dropdown menu to choose a colored solution. Adjust the concentration slider and observe the solution change. 3.Turn on the light source. Use the meter to measure either transmittance (light passing through) or absorbance (light absorbed). 4.Change the container width and measure the pathlength (distance light travels) using the ruler. How does this affect absorbance? 5.Set the wavelength panel from “Preset” to “Variable.”Explore different light colors. How does the color of light affect the amount absorbed or transmitted by the solution? 6.Predict which light color will be absorbed the most by the solution (usually the opposite of the solution’s color). Compare your prediction with the simulation’s preset values. 7.Analyze the wavelengths absorbed and transmitted by the solution. 8.Solutions appear colored because they absorb specific wavelengths of light and transmit others. For example, copper sulfate solutions appear BLUE because they absorb RED and YELLOW wavelengths, but transmit BLUE wavelengths. 9.If you get confused by the terms “absorbance” and “transmittance” you can use the meter to compare the light intensity before entering the solution with the transmitted light.  10.Transmittance is a percentage of light that passes through, while absorbance is the amount of light absorbed. Connecting to Real-World Labs: This simulation acts like a virtual spectrophotometer, shining light through solutions and measuring how much light passes through. It can help you understand how real laboratory equipment works! Remember: Play around with the simulation! This is your chance to explore and discover the relationships between solutions, light, and color. Conclusion This exploration with PhET’s Beer’s Law Lab allows you to virtually experiment with solutions and light. You’ve discovered how concentration, pathlength, and light color all influence the absorption of light by a colored solution. This knowledge can help you understand why solutions appear colored and how scientists use tools like spectrophotometers to analyze them.

Beer’s Law Read More »

Ion ratio of acidic and basic solutions

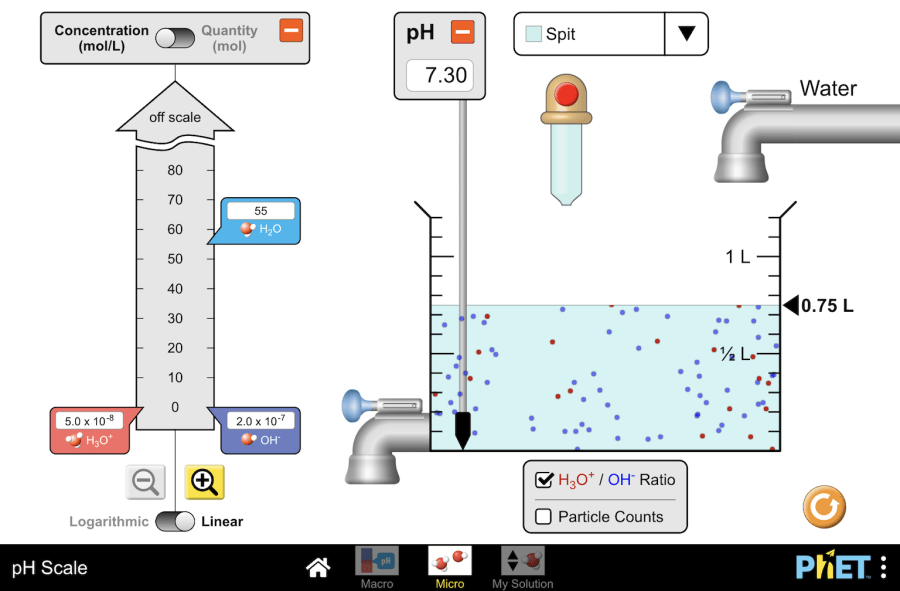
The title of the Project: Ion ratio of acidic and basic solutions This virtual laboratory is intended for use in chemistry classes on the following topics: Objectives: Practical part This simulation helps you understand the pH of everyday liquids and how it relates to the concentration of ions at the molecular level.   Step 1. The simulation has three screens: “Macro,” “Micro,” and “My solution.” Click on Micro to explore the relationship between pH and ions. Step 2. You’ll see a beaker, a list of solutions in a dropdown menu, a pH probe in the solution and water taps on the right.  Step 3. Select a solution from the available options. Let’s try soda pop. You’ll see from the scale that soda pop is acidic (around pH 2.5). Step 4. Observe the graph or scale on the left. It shows the concentration (in moles) of: Step 5. Notice the default logarithmic scale. This emphasizes the vast difference between hydronium and hydroxide concentrations.If unfamiliar with scientific notation, switch the graph to a linear scale. This visually emphasizes the magnitude of the difference between ion concentrations. Step 6: Click the ““H₃O⁺/OH⁻ ratio”” button. Red dots represent hydronium ions, and blue dots represent hydroxide ions. This view helps compare the relative amounts of these ions. Step 7: Try adding water to the soda pop using the taps. The red dots (hydronium) should still dominate, but the gap between red and blue might appear smaller. Step 8: Choose a solution with a neutral pH, like spit. In the ion ratio view, you should see roughly equal amounts of red and blue dots, reflecting a balanced concentration of hydronium and hydroxide ions. Conclusion This virtual pH scale simulation offers a valuable tool for 11th-grade chemistry students. By manipulating the simulation and observing the changes in ion concentrations, students can gain a deeper understanding of the relationship between pH and the microscopic world of ions in solution. This interactive approach can enhance their comprehension of a key concept in acid-base chemistry.

Ion ratio of acidic and basic solutions Read More »

The Ideal Gas Law (Clapeyron-Mendeleev equation)

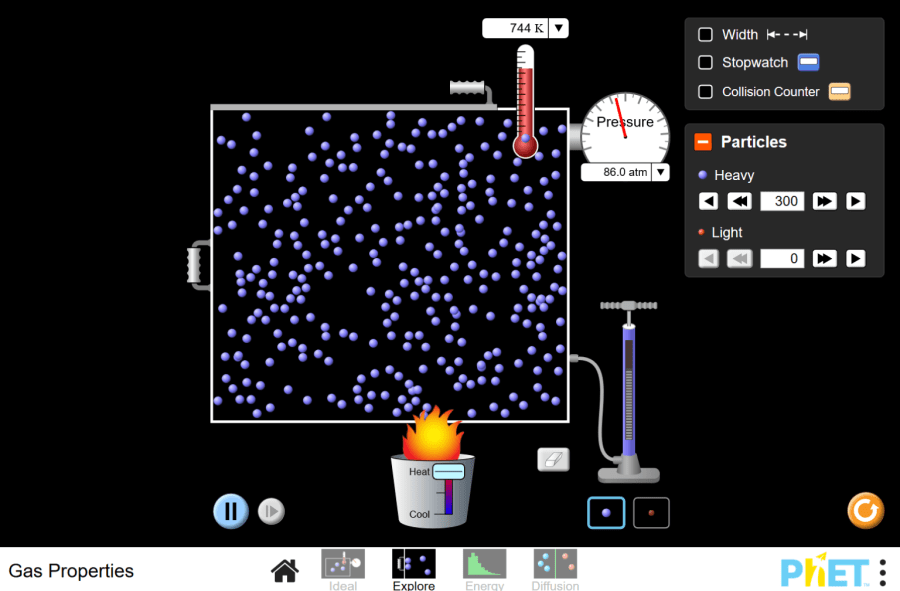
Project name: The Ideal Gas Law (Clapeyron-Mendeleev equation) This virtual laboratory is intended for use in chemistry classes on the following topics: Goals: Theory Gas laws describe the behavior of gases in different conditions. Understanding these laws helps us predict how gases will respond when we change their pressure, volume, or temperature. Ideal Gas Law The Ideal Gas Law, also known as the Clapeyron-Mendeleev Equation combines several simpler gas laws into one equation:  PV = nRT This equation shows how pressure (P), volume (V), number of particles (n), the gas constant (R), and temperature (T) are related. Boyle’s Law (P ∝ 1/V at constant T) Boyle’s Law states that if the temperature of a gas is kept constant, its pressure and volume are inversely proportional. This means: Equation: P₁V₁ = P₂V₂ Charles’s Law (V ∝ T at constant P) Charles’s Law states that if the pressure of a gas is kept constant, its volume and temperature are directly proportional. This means: Equation: V₁/T₁ = V₂/T₂ Gay-Lussac’s Law (P ∝ T at constant V) Gay-Lussac’s Law states that if the volume of a gas is kept constant, its pressure and temperature are directly proportional. This means: Equation: P₁/T₁ = P₂/T₂ Practical part 2. Get familiar with the components of the simulation: the particle system (gas molecules), the container, and the adjustable parameters such as pressure (P), volume (V), and temperature (T). Exploring Boyle’s Law (P ∝ 1/V at constant T) 4. Adjust Volume: a.Use the left wall of the container to change the volume. Reduce the volume and observe the pressure increase. b.Increase the volume and observe the pressure decrease. 5. Discussion: Boyle’s Law states that pressure and volume are inversely proportional when temperature is constant. Record your observations and plot P vs. 1/V to see the inverse relationship. Exploring Charles’s Law (V ∝ T at constant P) 7. Vary Temperature: a. Increase the temperature using the heater.Note how the volume of the container changes with temperature. Observe that as temperature increases, volume increases b. Decrease the temperature using the cooler. Observe that as temperature decreases, volume decreases too. 8.Discussion: Charles’s Law shows a direct relationship between temperature and volume when pressure is constant. Plot V vs. T and observe the linear relationship. Exploring Gay-Lussac’s Law (P ∝ T at constant V) 10. Vary Temperature: a. Use the heater to increase the temperature. Monitor how the pressure changes as the temperature changes. You should see that as temperature increases, pressure increases. b.Use the cooler to decrease the temperature. You should see that as temperature decreases, pressure decreases too. 11. Discussion: Gay-Lussac’s Law states a direct relationship between pressure and temperature when volume is constant. Plot P vs. T to visualize this direct proportionality. Applying the Ideal Gas Law (PV = nRT) a. Choose a fixed number of particles. b. Adjust one variable (e.g., volume) and observe changes in pressure and temperature. Predict changes based on the Ideal Gas Law before making adjustments. 14. Calculation Practice:You can work with different scenarios to calculate unknown quantities using PV = nRT, reinforcing the mathematical relationship. Conclusion Using the PhET “Gas Properties” simulation provided a hands-on approach to learning the Ideal Gas Law and its component relationships: Boyle’s Law, Charles’s Law, and Gay-Lussac’s Law. By engaging in interactive experiments, students were able to visualize and understand the behavior of gases under different conditions. The simulation effectively demonstrated the principles of these gas laws, helping students to connect theoretical concepts with practical observations. 

The Ideal Gas Law (Clapeyron-Mendeleev equation) Read More »

Avogadro’s Law

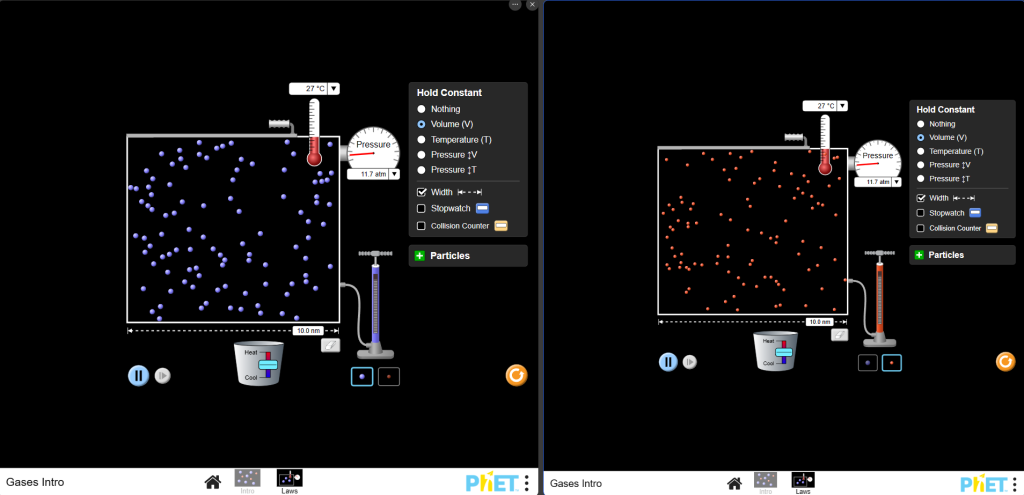
Project name: Avogadro’s Law This virtual laboratory is intended for use in chemistry classes on the following topics: Goals: Practical part In this Phet simulation, we will study Avogadro’s law. 1. Start the simulation. You will be given two modes: “Intro “ and “Laws”. Select the “Laws” mode. 2. Familiarize yourself with the tools. Virtual Experiment Avogadro’s Law: “Equal volumes of different gases under the same conditions (temperature and pressure) contain the same number of molecules.” 3. Duplicate the simulation: Use Split Screen mode on your computer / laptop. 4. In the Hold constant section,set the constant parameter to Volume (V).Check the box in the Width section. Now you have the same volume in both cases. 5. Pump two different gases into the container: one heavy, the other light. Pay attention to the pressure gauge and thermometer in both cases. 6. Repeat the experiment several times.What did you notice? With the same volume, the pressure and temperature in both containers are the same, regardless of the type of gas. Does this experiment support Avogadro’s Law? Conclusion In this work, using a virtual simulation of PhET Interactive Simulation: Gas Intro, an experiment was conducted that supports Avogadro’s Law. It was shown that with the same volume, the pressure and temperature in containers with different gases remain the same, regardless of the type of gas. This clearly demonstrates that, under the same conditions of temperature and pressure, equal volumes of ideal gases contain the same number of molecules.

Avogadro’s Law Read More »

Greenhouse Effect

The title of the Project: Greenhouse effect This virtual laboratory is intended for use in chemistry classes on the following topics: Purpose of the virtual laboratory work: Practical part Virtual experiment Conclusion: The virtual simulation “Greenhouse Effect” allows you to visually demonstrate how greenhouse gases affect the temperature of the Earth’s surface. With the help of the simulation, students can: Terminology Energy – Энергия – Энергия Photons –  Фотоны – Жарық фотондары Sunlight – Солнечный свет – Күн сәулесі Infrared – Инфракрасный – Инфрақызыл Greenhouse gas concentration – Концентрация парниковых газов – Жылыжай газдарының концентрациясы Energy balance – Энергетический баланс – Энергиялық тепе-теңдік Flux meter – Измеритель потока – Ағым өлшеуіші Surface thermometer – Поверхностный термометр – Беттік термометр Solar intensity – Интенсивность солнечного излучения – Күн сәулесінің қарқындылығы Surface albedo – Альбедо поверхности – Жер бетінің альбедосы Absorbing layers – Поглощающие слои – Сіңіру қабаттары  Infrared absorbance – Поглощение инфракрасного излучения – Инфрақызыл сәулелердің жұтылуы

Greenhouse Effect Read More »

Greenhouse effect

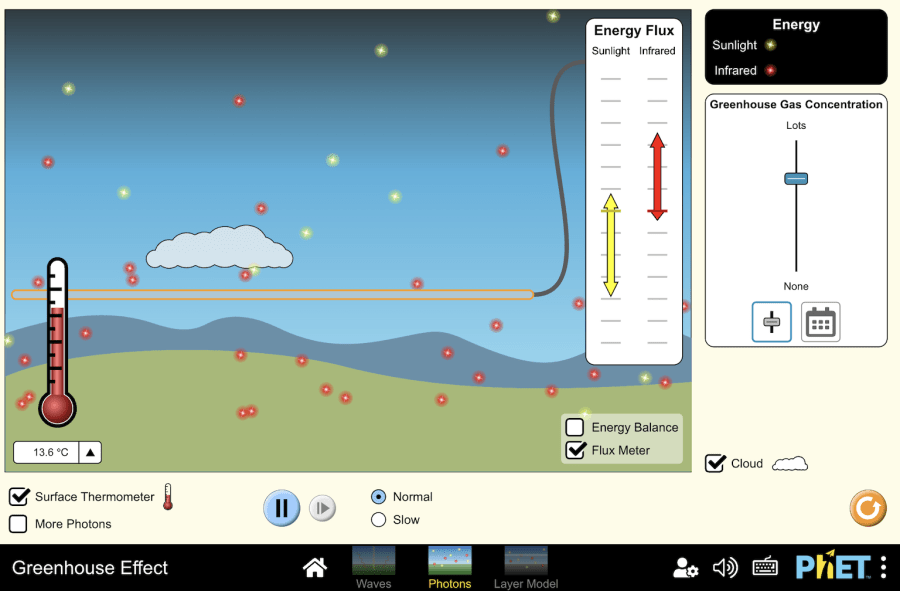
The title of the Project: Greenhouse effect This virtual laboratory is intended for use in chemistry classes on the following topics: Purpose of the virtual laboratory work: Practical part Virtual experiment 8. Drag the flux meter to just above the surface.  Click on Start Sunlight, and let the sim run until the surface temperature stabilizes.  The Earth absorbs the sunlight photons (yellow) and then radiates infrared photons (red).  9.  From the Flux Meter, record the units of both incoming and outgoing sunlight radiation in the table below.  Do the same for the infrared radiation.  Then, calculate the total incoming and outgoing radiation.  10. Add one absorbing layer, and make sure the flux meter is below the absorbing layer.  Let the simulation run until the surface temperature stabilizes and record the data in the table below.   Table 1. # of Layers Sunlight In Infrared In Total In Sunlight Out Infrared Out Total Out Surface T 0 4 0 4 1 3 4 -18°C 1 2 3               Conclusion By running the simulation, you observed that adding layers that absorb infrared radiation (heat) increased the Earth’s surface temperature. This mimics the real-world greenhouse effect, where greenhouse gases trap heat, leading to global warming. The more greenhouse gases in the atmosphere, the warmer the planet gets.

Greenhouse effect Read More »

Greenhouse gases

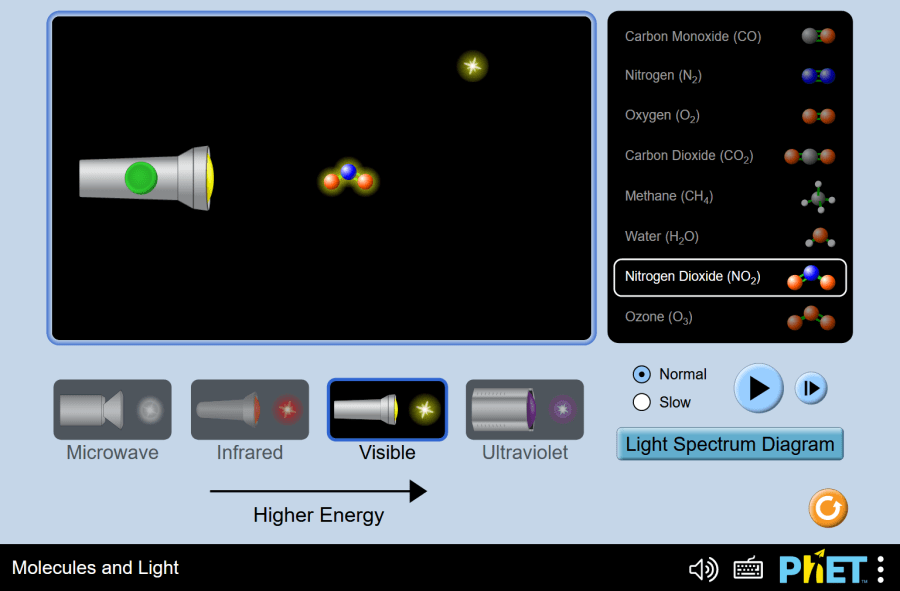
The title of the Project: Greenhouse gases This virtual laboratory is intended for use in chemistry classes on the following topics: Objectives: Practical part This guide will show you how to use the PhET “Molecules and Light” virtual simulation to explore how different light particles (photons) interact with various molecules. 1. Setting Up the Simulation: 2. Simulating Light Interaction: 3. Identifying Patterns: Table 1   Microwave Infrared Visible Light Ultraviolet CO          N2         O2         CO2         H2O         NO2         O3         4. Analyzing Photon Energy and Molecular Motion: 5. Resetting the Simulation: 6. Real-World Connections: 7. Exploring the Light Spectrum: Conclusion By using the PhET “Molecules and Light” simulation, students can experience an interactive learning to explore the interaction between light and different molecules. This helps them understand the scientific basis behind the greenhouse effect and its role in climate change.

Greenhouse gases Read More »

Atomic interactions

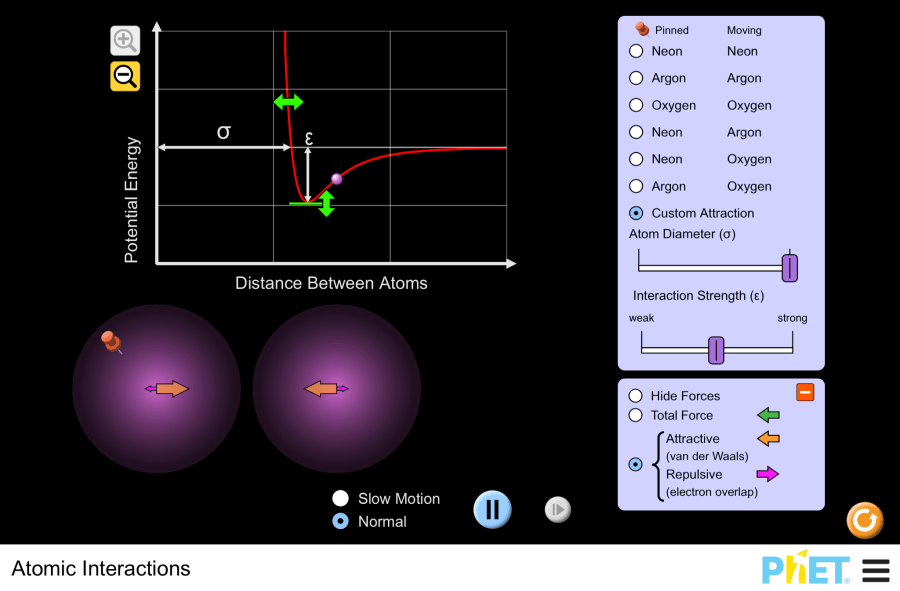
The title of the Project: Atomic interactions This virtual laboratory is intended for use in chemistry classes on the following topics: Objectives: Practical part Here’s a step-by-step guide on how to use the PhET simulation “Atomic Interactions”: 2. Observe the potential energy graph:  Below the graph, you’ll see two atoms. One is fixed, and you can move the other. The graph shows the potential energy (y-axis) versus the distance between the atoms (x-axis). The position of the movable atom is reflected on the graph. 3. Explore the distance and energy relationship: Observe the changes in potential energy on the graph. Move the unpinned atom closer:As the distance decreases (atoms get closer), the potential energy becomes more negative (deeper well on the graph). This indicates an attractive force, likely due to temporary fluctuations in electron distribution (van der Waals forces). 4. Move the unpinned atom very close: The potential energy sharply increases (steep rise on the graph) as the atoms get too close. This represents a strong repulsive force that prevents atoms from completely overlapping. This aligns with the Pauli repulsion principle, where electrons in the same orbital repel each other. If the atom goes off-screen, use the “Return atom” button to bring it back. 5.Visualize the forces:  Open the “Forces” panel. You can choose to display “Total Force” or separate “Attractive” and “Repulsive” force vectors. This can help you visualize the forces acting on the atoms as you move them. 6. Control the simulation speed:  Use the simulation controls to pause, step forward, or slow down the movement of the unpinned atom. This allows you to observe the changes more closely. 7. Compare bonded and non-bonded pairs:  Reset the simulation and choose a different atom pair, like Neon-Neon (non-bonded) or Oxygen-Oxygen (bonded). Compare the shapes of the potential energy graphs for these pairs. 8. Analyze the graph:  Use the zoom tool to see the entire potential energy graph clearly. This might help you understand the significance of values below zero for potential energy (which can be a challenging concept for some). 9. Identify sigma and epsilon:  Once you’ve compared bonded and non-bonded interactions, try to determine the meaning of sigma (σ) and epsilon (ε) based on the shapes of the corresponding graphs.Sigma (represented by the bump on the repulsive side) relates to the distance at which the repulsive force dominates. Epsilon (the depth of the attractive well) reflects the strength of the attractive force. These parameters define the Lennard-Jones potential, a mathematical model that captures both attractive and repulsive forces between atoms. 10. Explore custom attraction:  This feature allows you to investigate how atom size and interaction strength affect the potential energy. Zoom back in on the graph if needed. 11. Modify atom diameter:  Change the atom diameter using the slider or by dragging the arrow on the graph. Observe how both the graph and the atom representations update dynamically. 12. Adjust interaction strength:  Use the slider or the graph arrow to modify the interaction strength. See how this dynamically affects the potential energy graph. 13. Analyze relationships:  Relate the changes in atom diameter, interaction strength, and the resulting shape of the potential energy graph. This can help you understand how these factors influence the attraction between atoms. Conclusion The PhET simulation provides an interactive tool to visualize the interplay between attractive and repulsive forces acting on atoms. By manipulating the simulation, students observed how changes in distance, bonding, atom diameter, and interaction strength affect the potential energy graph.

Atomic interactions Read More »